Note
Click here to download the full example code or to run this example in your browser via Binder
Importing refractive index from a database
Retrieve and plot the refractive index of a material in the refractiveindex.info data.
import numpy as np
from pytheas import refractiveindex as ri
import matplotlib.pyplot as plt
We can get the refractive index from tabulated data or a formula using the
database in the pytheas.material module.
We will import the measured data from the reference Johnson and Christy [JC1972].
We first specify the file yamlFile we want to import:
yamlFile = "main/Au/Johnson.yml"
We then get the wavelength bounds from the data (in microns) and create a wavelength range to interpolate:
bounds = ri.get_wl_range(yamlFile)
print(bounds[0], bounds[1])
lambdas = np.linspace(0.4, 0.8, 300)
Out:
0.1879 1.937
Then get the refractive index data:
ncomplex = ri.get_complex_index(lambdas, yamlFile)
epsilon = ncomplex ** 2
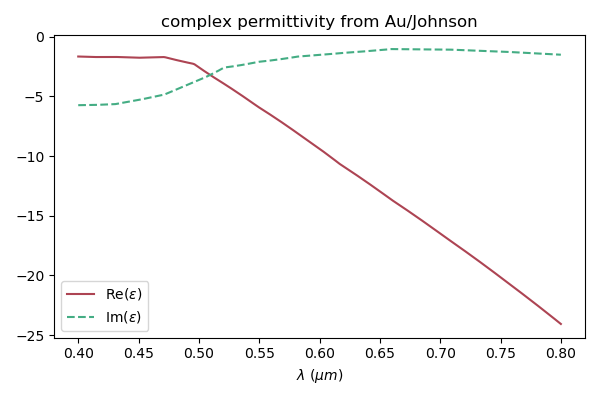
And finally plot it:
fig, ax = plt.subplots(1, figsize=(6, 4))
ax.plot(lambdas, epsilon.real, "-", c="#ad4453", label=r"Re($\varepsilon$)")
ax.plot(lambdas, epsilon.imag, "--", c="#44ad84", label=r"Im($\varepsilon$)")
ax.set_xlabel(r"$\lambda$ ($\mu m$)")
ax.set_title("complex permittivity from " + yamlFile[5:][:-4])
ax.legend(loc=0)
plt.tight_layout()
- JC1972
(P. B. Johnson and R. W. Christy. Optical constants of the noble metals, Phys. Rev. B 6, 4370-4379 (1972)).
Total running time of the script: ( 0 minutes 0.528 seconds)
Estimated memory usage: 13 MB